Keeping track of your website's uptime and performance is key to delivering a great user experience. With WP Umbrella, you're not only notified when downtime happens but can also review a detailed history of all incidents and status codes. This lets you analyze disruptions and take action to prevent future issues. 😊
Estimated Time to Complete: Less than 2 minutes
Prerequisites: A WP Umbrella account with at least one linked website
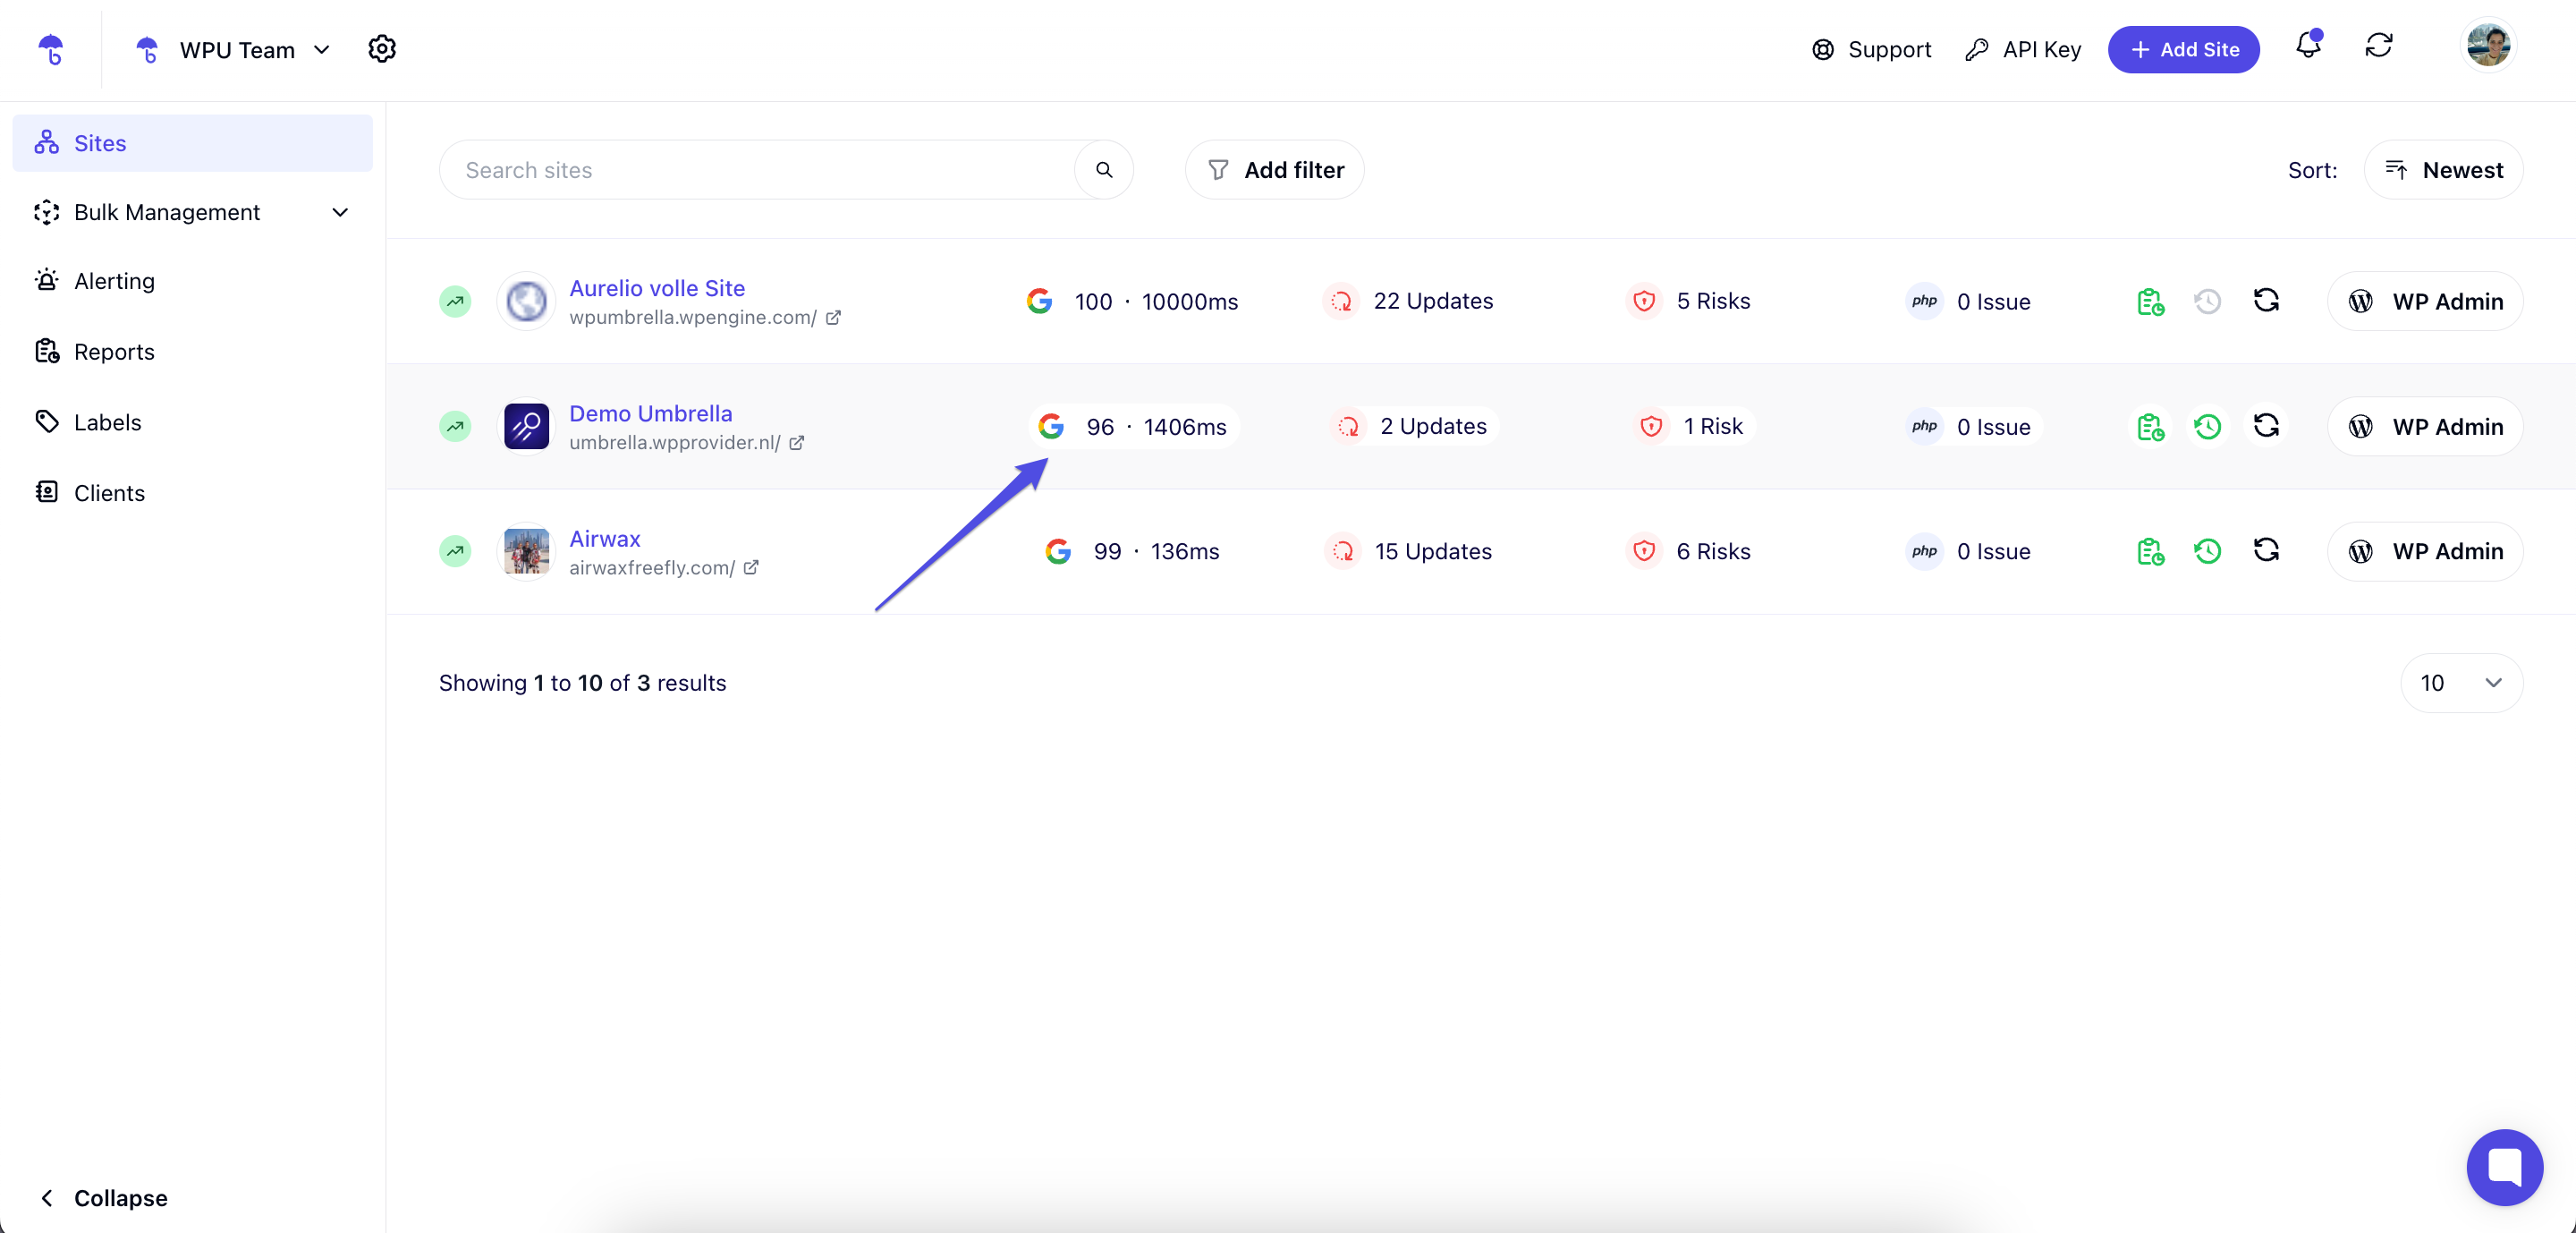
Log in to your WP Umbrella account.
Click on your website's response time or Google PageSpeed Score to open the detailed monitoring view.
On the right-hand side of the page, you’ll see detailed information about your website’s downtime.
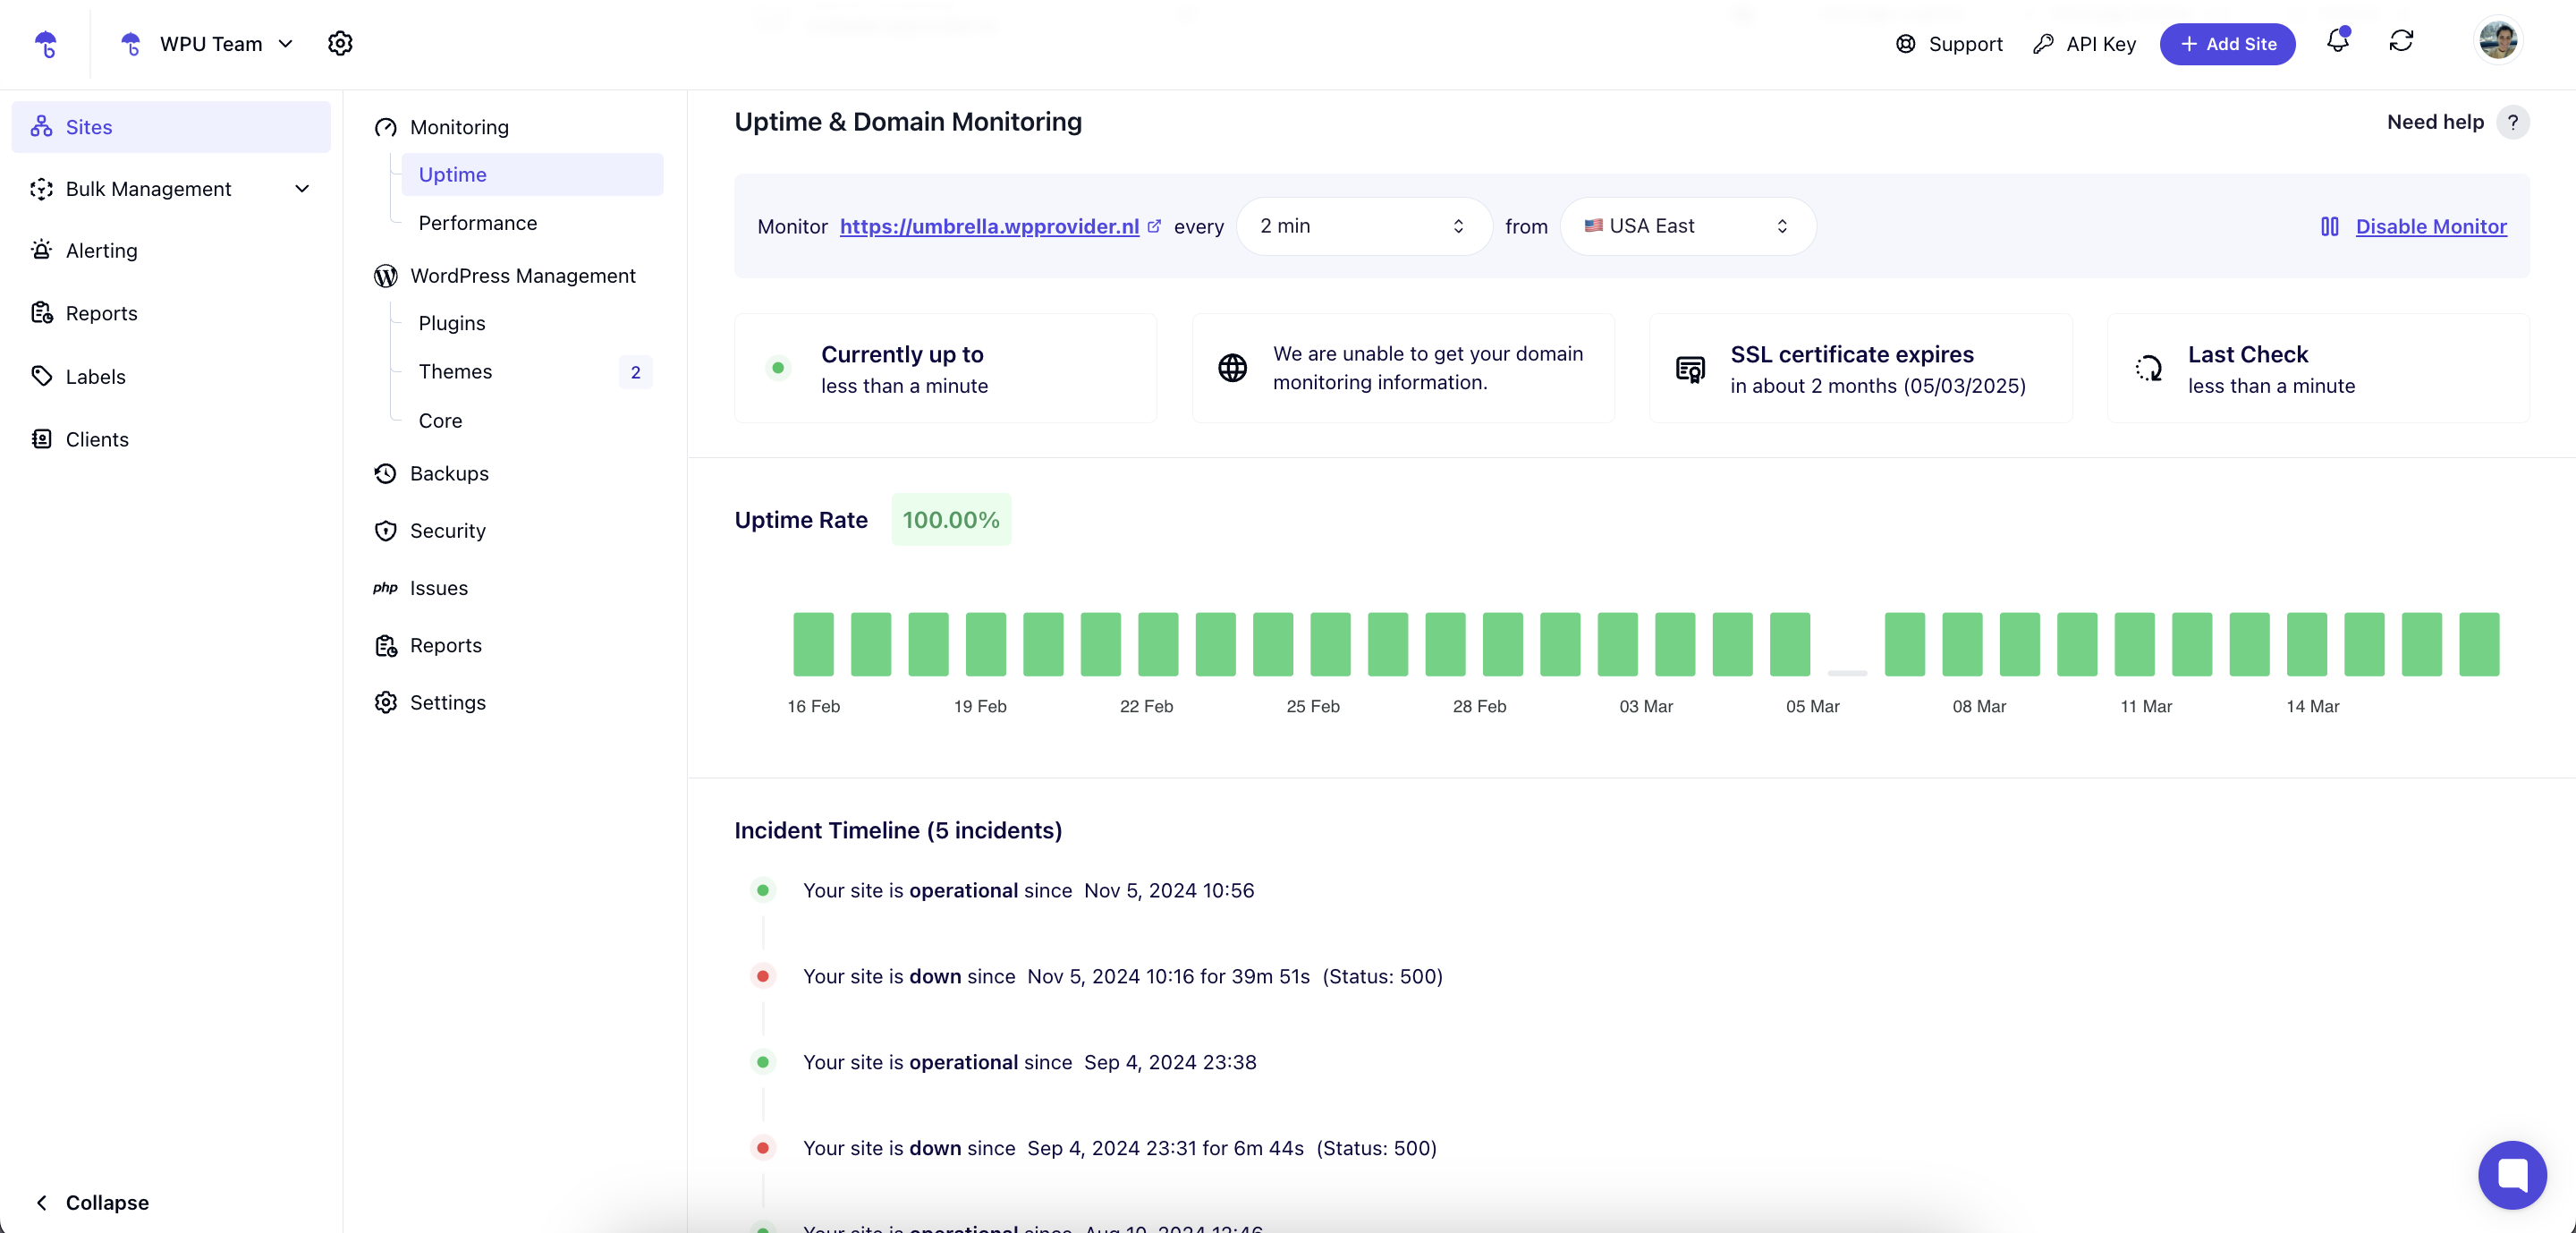
This includes:
The status code (500, 503, 404, etc.)
The duration of each downtime incident

1. Why don’t I see any downtime history?
If your site has not experienced downtime, the history may be empty. You can check your monitoring settings to ensure everything is correctly set up.
2. What do the status codes mean?
Status codes like 500, 503, or 404 help identify what caused the downtime (e.g., server errors, unavailable services, or missing pages).
3. Can I adjust how often my site is monitored?
Yes! You can update your monitoring frequency in your site's Settings tab under the Performance section.
4. Why is the downtime duration not exact?
The downtime duration reflects the monitoring interval you selected. Shorter intervals provide more precise data.
5. How can I get notified when downtime occurs?
Ensure your alerts are configured under the Alerting tab to receive email or Slack notifications.
🎉 That’s it! Now you know how to easily access and understand your website's downtime and incident history using WP Umbrella. This feature gives you valuable insights to keep your site running smoothly and avoid surprises. If you have any questions, don’t hesitate to reach out to our support team—we’re always happy to help! 💬🙌
